Chapter 8 – Starcharts (Startrax)
Posted: April 13, 2013 Filed under: Starcharts, ZX Spectrum Astronomy | Tags: Astronomy, Constellations, Maurice Gavin, Programming, Sinclair Basic, Starcharts, Stars, Startrax, Stellar Proper Motion, ZX Spectrum Astronomy Leave a commentStarmaps, display a simple starmap
Constellation Plot, entering star patterns with CHR$ CODEs
Stellar Magnitudes, plotting differing star brightnesses
Star Graphics, constructing complex shapes
Flashing Stars, two ways to make stars flash
Startrax, watch the changing shapes of the constellations over hundreds of thousands of years
Stellar Magnitude, magnitude ranges of stars.
Startrax (Stellar Proper Motion)
Astronomy, the study of the heavens, is the oldest science known to man: it dates back to 2000 BC, to the Chaldeans of Asia Minor. The star groupings or constellations familiar today were named by them. A remarkable feature of the constellations is that after 4000 years they appear virtually identical to us today as they did to those early astronomers — despite the fact that we know most stars are moving through space at tens of kilometres per second.
Why are the constellations not distorted beyond recognition by this random motion? Quite simply, the stars are so remote — distances measured in tens or hundreds of light years — the individual movements are undetectable to the unaided eye. Only one star, Arcturus at 36 light years distance, has moved appreciably since early Greek star maps were prepared. And even this amount is very little — about the diameter of the full moon, ie½°.
To see the constellations change shape, it is necessary to have a time scale of hundreds of thousands of years and this program simulates this effect on two selected star groups — the Plough and Orion. The DATA is taken from Hutchinson’s Splendour of the Heavens (1923). You have the option of allowing the individual stars to ‘trail’ their image across the screen or to PLOT as a moving pixel. The screen is presented in inverse video — BORDER 0: PAPER 0: INK 9.
In order that the PLOTting of the constellation selected is as smooth as possible, the individual star positions in the a$ are entered into DIMensional arrays x and y, the coordinate positions of each star. These arrays incorporate the ‘proper motion values’, as they are called, from the m$. How these values in the m$ are constructed will be described in detail later.
Economising memory
The method of handling the DATA is economical on the Spectrum memory (RAM). Although there is no real necessity in this case to save memory, the technique may be of interest and perhaps of use in your programming. As noted, the a$ contains the star positions and these are held as two 2-bit numbers:
Line 90
09 (x coordinate star 1)
17 (y coordinate star 1)
18 (x coordinate star 2)
22 (y coordinate star 2)
and so on to the end of the string array (star 16).
The m$ contains two 1-bit numbers per star to indicate the star’s xx,yy proper motion, so the LENgth of the respective m$ is precisely half that of the associated a$. The a$ and m$ are repeated to the end of the DATA: each pair is used for a separate constellation. In order that the correct DATA is used on RUNning the program a conditional GOTO must be incorporated immediately after each pair of string arrays, ie:
110 IF b$(l) = “P” THEN GOTO 150
then the program will jump out of the DATA, carrying the last values of a$ and m$ which were read. The last pair of string arrays does not need a conditional GOTO as it is assumed to be the selected pair by default. Between lines 110 and 120 there is room for three more constellations via your DATA without renumbering or using multiline statements.
Remember that the first letter of the b$ (used to INPUT the name of the constellations in line 30) must be included in the associated conditional GOTO. The example in Line 110 is ‘P’ for the Plough. By only requiring one letter (the first) to be correct, the program will ignore user misspellings (a necessary precaution as some of the constellation names can be very difficult).
Selecting DATA
The LENgth of the m$ is now used to DIMension to x and y arrays and the routine to Line 270 is used to enter the DATA into these arrays. In the case of Orion, with 20 stars and 20 positions for each star to be computed for subsequent PLOTting, this makes 400 x and 400 y positions. While the Spectrum does the necessary computation it displays a neat little ‘I am computing’ routine. Of course you could place every constellation (whether called upon for immediate display or not) into a DIMensional array but at 800 bytes per constellation it seems a little unnecessary for this program at least. In this program, the arrays are only reDIMensioned if the alternative constellation is called for display. Lines 50 and 60 recognise this condition and jump straight to the display if the same constellation is selected be it for a trailed or ‘point image’.
Proper motion values
The point of this program lies in the proper motion values in the m$, which permits stars to move in any direction and velocity across the screen. Figure 8.15 explains the principle.
Figure 8.15
Typical grid layout for estimating the relative motion of stars in a Proper Motion program. + in the centre of the grid marks the point of rest (ie no motion required). The xx and yy coordinate positions are measured from the bottom right corner. Note that the east (e) and west ![]() positions appear reversed from the normal convention. It is usual in astronomy to represent the skies above our heads with east to the left of south, which is the case here.
positions appear reversed from the normal convention. It is usual in astronomy to represent the skies above our heads with east to the left of south, which is the case here.
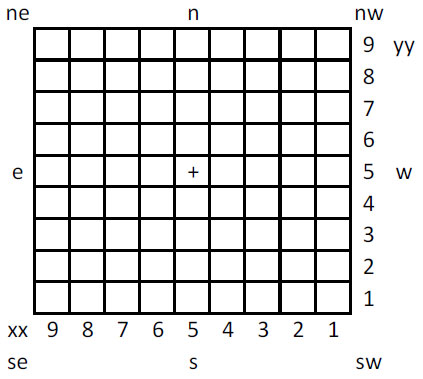
Figure 8.16
Examples of typical values which could be used in the program. The further the selected coordinates are from the centre of the grid the faster a star will move in that direction. These values are incorporated into the m$ until all the stars in the constellation are included.
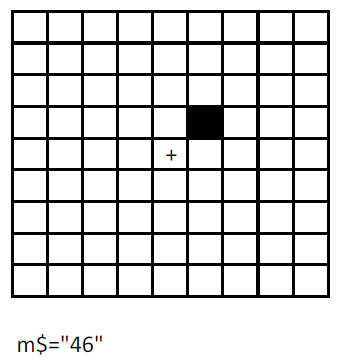

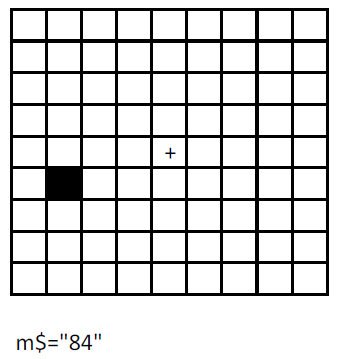
Figure 8.17
The familiar star pattern of Orion as seen today.
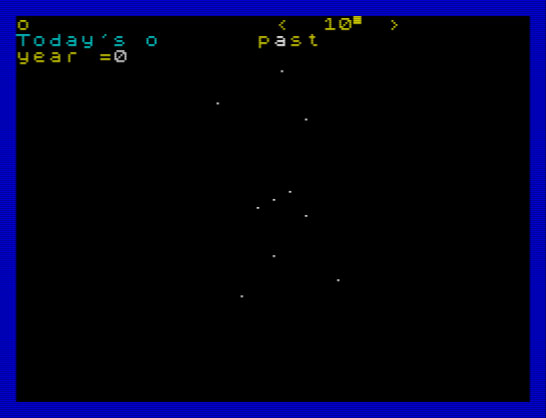
Figure 8.18
The apparently random motion of the stars in Orion over 200,000 years.

The grid is divided into nine horizontal (xx coordinate) and nine vertical (yy coordinate) boxes, a total of 81 boxes. To be different from the Spectrum PRINT and PLOT systems these coordinates start from the bottom right position. A star at ‘rest’ is placed at the centre of the grid and has an xx, yy coordinate value of 55. As a star is placed further from the centre of the grid, the velocity increases proportionally and in the direction indicated. For example a value of 46 indicates a small movement towards the NW (the top right corner). A value of 19 indicates the largest movement to the NW direction and so on for all points of the compass. Some typical sample values are shown in Figure 8.16.
Before the m$ VALue is entered into the x and y arrays, a value of – 5 is deducted from each number. Thus our m$ VALue of 55 becomes 00, ie no relative motion, and 46 becomes -1 +1. In this way only positive numbers need to be contained in the m$ although the required VALues are sometimes negative. The conversion is done in Lines 180 and 190. The FOR /NEXT f loop from Line 220 allocates the values to the x and y arrays which are incremented by the m$ values in Lines 230 and 250. In the final display the FOR/NEXT loop contains 20 STEPs and the middle STEP 10 represents the form of the selected constellation as we know it today. Thus a brief but powerful program results.
Screen display
The method of preparing starmaps on the Spectrum is described more fully in the Starmaps program. Let it suffice here to say that this example uses a screen resolution of 64*44 pixel positions in the DATA of the a$ and that this is expanded to the full 256*176 of the Spectrum by multiplying each PLOT position in Line 360 by 4. One point should be observed if you extend the program to include your own selected constellations. Avoid the edge of the screen with your basic starmaps. The proper motion in a star’s movement will cause the program to crash if it attempts to PLOT beyond the maximum coordinates (255 for x; 175 for y). Figures 8.17 and 8.18 are typical screen COPYs.
10 REM Startrax
20 LET c$=””
30 INPUT FLASH 1;”Plough or Orion “;b$
40 INPUT “Trailed or point images (t/p)? “; LINE t$
50 IF c$=b$(1) THEN GO TO 290
60 LET c$=b$(1)
70 BORDER 0: PAPER 0: CLS
80 INK 9: FOR n=1 TO 9: PRINT PAPER n; FLASH 1;AT 5+n,11;”COMPUTING”: NEXT n: GO SUB 500
90 LET a$=”09171822252133203614472648195321″
100 LET m$=”3594938484268484″
110 IF b$(1)=”p” OR b$(1)=”P” THEN GO TO 150
120 LET a$=”2533333736313020322134223214280940113619″
130 LET m$=”94499797497995954949″
150 DIM x(LEN m$,20)
160 DIM y(LEN m$,20)
170 FOR n=1 TO LEN m$ STEP 2
175 LET h=n*2
180 LET d=VAL m$(n)-5
190 LET e=VAL m$(n+1)-5
200 LET a=VAL a$(h-1 TO h)+d
210 LET b=VAL a$(h+1 TO h+2)+e
220 FOR f=1 TO 20
230 LET a=a-d/10
240 LET x(n,f)=a
250 LET b=b-e/10
260 LET y(n,f)=b
270 NEXT f: NEXT n
290 CLS : PRINT INK 6; b$; “10chr$ 130” “,”in the distant past”,”year =”
300 FOR n=1 TO 20
310 LET y=-1e5+1e4*n
320 PRINT AT 2,6;y;” ”
330 IF t$=”t” THEN FOR f=1 TO 0 STEP -1
340 IF t$”t” THEN FOR f=0 TO 1
350 FOR p=1 TO LEN m$ STEP 2
360 PLOT BRIGHT 1; OVER f;x(p,n)*4,y(p,n)*4
370 NEXT p
380 IF y=0 AND f=0 THEN GO SUB 430
390 IF y=1e5 AND f=0 THEN GO SUB 420
400 PAUSE 1+10*(1-f)
410 NEXT f
420 NEXT n: GO SUB 500
425 GO TO 30
440 PRINT INK 5;AT 1,0;”Today’s “;b$;” “: GO SUB 500
450 PRINT INK 4;AT 1,0;”and in the future “: RETURN
500 FOR v=0 TO 5: FOR k=7 TO 0 STEP -1: BORDER k: BEEP .01,40-k: NEXT k: NEXT v: RETURN

