Appendix – Magazines and Clubs
Posted: April 20, 2013 Filed under: Appendix, ZX Spectrum Astronomy | Tags: Appendix, Astronomy, Clubs, Magazines, Maurice Gavin, Sinclair Basic, ZX Spectrum Astronomy Leave a commentMagazines and Clubs
General Astronomical Magazines
The following publications deal exclusively with astronomy. They occasionally include articles on astrocomputing for the home micro.
Sky & Telescope
49 Bay State Road, Cambridge, Massachusetts 02238 – 1290 — monthly $2.00 plus postage, subscription only
Journal of the British Astronomical Association
Dept. SA, Burlington House, Piccadilly, London W1V ONL — bimonthly £2.75, free to members
Astronomical Clubs and Associations
British Astronomical Association
Dept. SA, Burlington House, Piccadilly, London W1V ONL
Junior Astronomical Society
Dept. SA, Mr V. L. Tibbott, 58 Vaughan Gardens, Ilford, Essex IG1 3PD
The Federation of Astronomical Societies
Dept. SA, Mrs R. Naylor, 24 Julia Crescent, Stonebroom, Derby DE5 6LS
American Association of Variable Star Observers
187 Concord Avenue, Cambridge, Massachusetts 02138
Association of Lunar and Planetary Observers
PO Box 3AZ, University Park, Les Cruces, New Mexico 88001
Any of the above organisations should be able to advise on affiliated local clubs.
Chapter 10 – Spectrum Hints and Tips (The ZX Printer)
Posted: April 20, 2013 Filed under: Spectrum Hints and Tips, ZX Spectrum Astronomy | Tags: Maurice Gavin, Peripherals, Programming, Sinclair Basic, Spectrum Hints and Tips, ZX Printer, ZX Spectrum Astronomy Leave a commentError-trapping of entries
Line renumbering
The ZX printer, Looking after your LLISTings.
ZX printer notes
Whilst developing a long program it can be exceptionally tedious to have to search for and compare ‘pages’ of program listing. Hardcopy via the ZX printer will help you retain your sanity! A complete LLISTing is often unnecessary — just a few lines printed for comparison with the screen page of interest with … LLIST n (for line number) and BREAK when sufficient, is printed.
Storing program listing from the ZX printer
The metalised ZX printer paper is very sensitive to finger marks and should always be handled by the edges. If you are preparing a listing for submission to a magazine, I advise you to take the precaution of washing your hands immediately before touching the surface — accidents will happen.
Two widths of ZX printer will fit side by side on an A4 sheet of paper. A minimum of 20 mm margins at the top and bottom of the page is preferable — the listing trimmed with a Stanley knife and straight edge. Be sure to cut precisely between the lines of print. Sellotape the listings, very lightly, face down on old newspaper and spray the backs with aerosol adhesive. Now carefully apply the listing to the A4 sheet using a light pressure. Get the listing photocopied for your own reference and store the original listing — unfolded of course — in a strong envelope until needed.
A cheap A4 photograph album with cellophane leaf overlays is an ideal place for storing short programs, routines and graphic printouts. This also keeps them safe from prying (and dangerous!) fingers. If you do not possess (or your household objects to the use of) picture rails to suspend long listings, then rolling listings in the discarded cores of toilet paper may suffice — the dimensions are just right to give the necessary protection.
If a long listing is sent through the postal system in rolled form it must be supported on a firm core — like the one at the centre of the ZX printer rolls.
Chapter 10 – Spectrum Hints and Tips (Line Renumbering)
Posted: April 20, 2013 Filed under: Spectrum Hints and Tips, ZX Spectrum Astronomy | Tags: Line Renumbering, Maurice Gavin, Programming, Sinclair Basic, Spectrum Hints and Tips, ZX Spectrum Astronomy Leave a commentError-trapping of entries
Line renumbering
The ZX printer, Looking after your LLISTings.
Line renumbering programs
If you go beyond the shortest routine (and even short routines have a habit of growing like Topsy!) a renumbering program can be a great time saver and will make your final listings more presentable. Various versions — preferably in machine code and stored above RAM — are available commercially on tape. It will be worthwhile, too, even if you choose to key in a program published in a magazine, to have GOTOs and GOSUBs automatically renumbered.
Conditional GOTOs or GOSUBs, like .. .GOTO sky… or.. .GOSUB k*10… may not be renumbered and must be done manually and in a methodical manner. For example, if your program contains:
… LET sky =1000
… GOTO sky
1000 PRINT “starchart”
then amend Line 1000 to read ‘1000 PRINT “starchart” : REM GOTO sky’. Once the program has been automatically renumbered, amend the variable ‘sky’ to the new line number:
… LET sky = (line number with “REM GOTO sky” at end of it)
In the absence of these REM statements as ‘ flags’ the process can be a long chore.
Chapter 10 – Spectrum Hints and Tips (Error-trapping of entries)
Posted: April 20, 2013 Filed under: Spectrum Hints and Tips, ZX Spectrum Astronomy | Tags: Error Trapping, Maurice Gavin, Programming, Sinclair Basic, Spectrum Hints and Tips, ZX Spectrum Astronomy Leave a commentError-trapping of entries
Line renumbering
The ZX printer, Looking after your LLISTings.
Every programmer acquires some working knowledge of the strengths and foibles of the computer system he uses and I have done this with the Spectrum. Because of computing’s very nature, some of these discoveries tend to be repeated for many different people, so apologies to all who have read some of mine elsewhere or have found them out for themselves.
Error-trapping of entries
Generally any extensive error-trapping is omitted from this book for the sake of brevity. The following routines are offered as guidance — I leave it up to you to decide which part of your program(s) to place them in. Don’t forget to renumber the lines.
1) Protecting numeric iNPUTs within upper and lower limits for DATE and TIME
100 INPUT “month no”, month
110 IF INT month month OR month 12 THEN
GOTO 100
120 INPUT “day no”, day
130 IF INT day day OR day 31 THEN GOTO 120
140 INPUT ”hour (0 to 23)”, hour
150 IF INT hour hour OR hour 23 THEN GOTO 140
160 INPUT “minute (0 to 59)”, min
170 IF INT min min OR min 59 THEN GOTO 160
180 REM program continues INPUTs complete
The following routine is much superior in rejecting any INPUTs that are not composed entirely in numbers (Line 520) and within limits (Line 550).
2) Protecting INPUT to numeric only within upper and lower limits for DATE and TIME
200 LET a$ = “Year”: LET a = 2000: LET b = 1834: GOSUB 500 : LET y = c
210 LET a$= “Month”: LET a = 12: LET b= 1: GOSUB 500 : LET m = c
220 LET a$ = “Day”: LET a = 31: GOSUB 500 : LET d = c
230 LET a$ = “Hour”: LET a = 23: LET b = 0: GOSUB 500 : LET h = c
240 LET a$ = “Minute”: LET a = 59: GOSUB 500 : LET mi = c
250 LET a$ = “Second”: GOSUB 500 : LET s = c
260 REM program continues INPUTs complete 270 ………
500 INPUT (a$;”(“;b;” to “;a;”)”;), LINE b$ 510 FOR x = 1 to LEN b$
520 IF CODE b$(x) 57 THEN GOTO 600
530 NEXT x
540 LET c = VAL b$
550 IF c> a OR c< b THEN GOTO 600
560 RETURN : REM INPUT checked OK
600 PRINT # 0 ; FLASH 1 ; “Entry error”: PAUSE 100: GOTO 500
Note: The values of a and b in Line 200 may be for any selected years. Line 500 appears on the screen (using the Year INPUT as an example) as:
Year (1834 to 2000)
Chapter 9 – Further Programs (Spectrum World Map)
Posted: April 20, 2013 Filed under: Further Programs, ZX Spectrum Astronomy | Tags: Astronomy, Further Programs, Maurice Gavin, Programming, Sinclair Basic, Spectrum World Map, ZX Spectrum Astronomy Leave a commentThe Messier List, check out the fake comets
Telescope, the facts about telescopes, binoculars, cameras and astronomy
Star Tester, a quiz
Ellipses, various ellipses
Spectrum World Map, a map of the world in CHR$ CODE.
Spectrum World Map
One of the problems of producing a picture on the TV screen from a program listing is trying to comprehend what graphics the author intended to be used. The Spectrum is capable of over 44,000 pixel positions (256*175) and it would be quite unreasonable to create a full screen image defining the x and y coordinates of all the pixels to be displayed. It is however quite reasonable to create a simple ‘lo-res’ screen image using the Spectrum chunky graphic set from CHR$ 128 to CHR$ 143 inclusive. This effectively gives a screen resolution of 64*44 pixels (c for chunky!) or 2816 in total.
Fortunately, by selecting the correct graphic characters for each four adjacent pixels a complete screen can be defined in 32*22 character spaces, 704 in total. Now it becomes manageable.
Coding the characters
The simplest way to produce such a screen image is to list 22 consecutive PRINT statements, each containing up to 32 chunky graphic characters, and RUN them. Easy for the programmer but almost impossible for subsequent users to understand. The intended characters must be coded in a legible form that can be keyed in with certainty.
The following program does just that and uses a world map as a demonstration screen display. Once the data has been entered, in a mixture of numbers and upper and lower case letters, the program automatically produces the finished picture via an intermediate coded form. This proves quite interesting to watch.
The program
Key in the program and RUN it. Then enter the lines of coded data line by line from Figure 9.10a. The program is reasonably error-trapped, giving a full opportunity to correct any entry, and is well prompted. Once all 20 lines are completed (two lines are omitted for titling, etc) the program converts the codes into the world map and displays the result recalled by PRINT T$
Figure 9.10: Picture Drawing in Code Form
a) These codes are entered into the program as prompted. The numerics refer to the number of consecutive solid squares — CHR$ 143. The lower case letters refer to the number of blank squares — CHR$ 128.

b) The computer converts the numeric and lower case codes from a) to upper case letters, Tilling each character square.

c) The computer converts the upper case letters in b) to the Spectrum chunky graphic set (CHR$ 128 to CHR$ 143 inclusive). The whole picture is stored in T$ for instant recall.

Saving the DATA
The actual picture is now stored in the DIMensioned T$ array ready to be SAVEd as prompted by the program, the DATA as SAVEd can be MERGEd into other programs as follows:
LOAD “world” DATA T$() ENTER
The picture is still called T$ so beware that this array name is not repeated in the new program: and, of course, the program must be started with GOTO (line number) and not RUN.
This particular program has now done its job and can in theory be discarded. But, before doing so, SAVE the complete program on to tape with GOTO 9990 for use with your own coded pictures.
Making your own coded pictures
The procedure to produce these coded pictures is tedious and is only worthwhile if they are to appear in published form. Page 92 of the Spectrum Manual lists the 16 chunky graphic set characters and these should be marked A through to P, starting at CHR$ 128 as A and finishing at CHR$ 143 as P. The artwork is now prepared on squared paper using page 102 of the Manual for guidance by overlaying tracing paper using the best shapes from the chunky graphic set. These are then converted into letters A to P inclusive as appropriate.
As the bulk of a simple picture is usually either blank or solid black (or any other INK colour) the long strings of AAAAAAAA or PPPPPPP can be compressed in each horizontal line to lower case letters or numerals respectively. Use Figure 9.10a for guidance. For example, the final line:
gGx means AAAAAAAGAAAAAAAAAAAAAAAAAAAAAAAA
where g equals the 7th letter of the alphabet and x the 24th.
Those with programming experience can get the Spectrum to do the conversion of chunky graphics to alphanumeric codes and so ease the task.
50 DIM e$(20,32)
60 DIM z$(20,32)
70 PRINT “WM coder – enter line”
80 FOR n=1 TO 20
90 PRINT AT 0,22;n
100 INPUT “Codes”‘ LINE e$(n)
110 PRINT AT n,0;e$(n)
120 INPUT “OK (y or n)? “; LINE q$: IF q$=”n” THEN GO TO 100
130 NEXT n
140 PRINT PAPER 5;AT 0,0;”*World Map recoded* ”
150 FOR n=1 TO 20: LET h$=””
160 FOR f=1 TO 32: LET x$=””
170 IF e$(n,f)>CHR$ 80 THEN GO TO 220
180 IF e$(n,f)<CHR$ 65 THEN GO TO 250
190 LET h$=h$+e$(n,f)
200 NEXT f: PRINT PAPER 6;h$: LET z$(n)=h$: NEXT n: GO TO 310
220 FOR x=1 TO CODE e$(n,f)-96
230 LET x$=x$+"A": GO TO 280
250 FOR x=1 TO CODE e$(n,f)-48
260 LET x$=x$+"P": GO TO 280
280 NEXT x: LET h$=h$+x$
290 GO TO 200
310 PRINT PAPER 6;AT 0,0;"**World Map** "
320 BORDER 5: LET w$=""
330 FOR n=1 TO 20
340 FOR f=1 TO 32
350 LET t=CODE z$(n,f)+63
360 PRINT INK 2; PAPER 5;CHR$ t;: LET w$=w$+CHR$ t
370 NEXT f: NEXT n: DIM t$(640): LET t$=w$
380 PRINT "T$=World Map – press 's' to save": PAUSE 0
400 SAVE "world" DATA t$()
405 BEEP 1,1
410 PRINT #0;"Rewind/play to verify": VERIFY "world" DATA t$()
430 BEEP 1,1: PRINT FLASH 1;"data saved OK": STOP
Chapter 9 – Further Programs (Ellipses)
Posted: April 20, 2013 Filed under: Further Programs, ZX Spectrum Astronomy | Tags: Astronomy, Ellipse, Ellipse Routines, Further Programs, Maurice Gavin, Programming, Sinclair Basic, Trigonometry, ZX Spectrum Astronomy Leave a commentThe Messier List, check out the fake comets
Telescope, the facts about telescopes, binoculars, cameras and astronomy
Star Tester, a quiz
Ellipses, various ellipses
Spectrum World Map, a map of the world in CHR$ CODE.
Ellipses
For astronomical presentations an ‘ellipse’ command is sadly missed from the Spectrum (and most other micros for that matter) but the following short routines will suffice, using the machine’s trigonometry functions of SIN and COS. These routines prove much less cumbersome than some published examples using complex algebraic formulae. Also keeping the routine brief ensures that the results are executed quickly, so speeding up the PLOTting process.
Effectively an ellipse is a circle seen at an angle so that its form is compressed. With minor changes, each routine can be made to PLOT in a clockwise or anticlockwise direction with the long or major axis either vertical or horizontal.
The Ellipse routines
Key in and RUN the first routine called Ellipse (see Figure 9.6). You will notice that in most cases the variable names are sufficiently long to describe their function in the program:
xaxis = x (horizontal) coordinate position
yaxis = y (vertical) coordinate position
rad = maximum radius of ellipse called semimajor axis
tilt = INPUT angle of tilt to a circle
angle = compression factor to produce an ellipse
The formula in the variable ‘angle’ contains a small make-weight value of 0.1 added to a variable ’tilt’. This is done to stop the program crashing if an INPUT of 0° is made (a circle shown edge-on). The value returned by 0° would be a truly infinite number exceeding the Spectrum’s numeric capacity which is limited to a range from 3*10-39 to 7*1038.
The short routine called Ellipse Angle Values (Figure 9.7) shows what values are returned by the formula called angle between 0° and 90° in whole degree steps.
In reality, 0° is made to return a value as if 0.10, ie 1/10° or 6′ arc, and 0.1 is added throughout the sequence. The Spectrum’s PLOTting accuracy is well below this small angle and the results (as PLOTted) are indistinguishable from whole degrees.
It should now be evident that if the somewhat improbable INPUT angle for tilt of -0.1° is made, the Ellipse program will crash because:
– 0.1 + 0.1 = 0°
Figure 9.6
An ellipse from full circle to edge-on is produced via this routine.
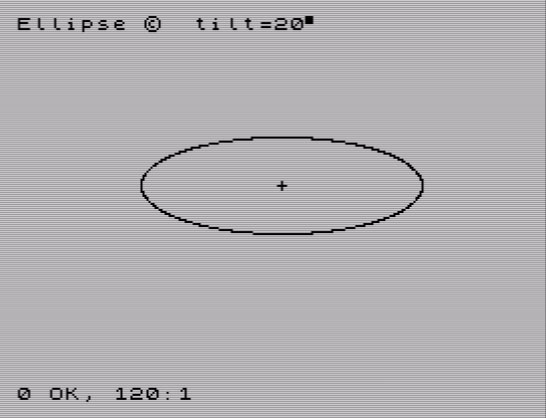
10 PRINT “Ellipse @ tilt=”;
30 LET xaxis=132: LET yaxis=91
40 LET radius=70
50 INPUT “0CHR$130 to 90CHR$130 “,tilt
60 PRINT tilt;”CHR$130 ”
70 PRINT AT 10,16;”+”
80 LET angle=1/SIN ((.1+tilt)/180*PI)
90 INPUT “step (1 to 10)”,s
100 FOR f=0 TO PI*2 STEP 1/s/10
110 PLOT xaxis+SIN f*radius,yaxis+COS f*radius/angle
120 NEXT f
Figure 9.7
1 REM Ellipse angle values
5 FOR x=0 TO 90
7 LET tilt=x
10 LET angle=1/SIN ((.1+tilt)/180*PI)
20 PRINT angle,tilt;CHR$ 130
30 NEXT x
Ellipse 4
This routine is precisely the same as the above routine but is used to demonstrate the simultaneous PLOTting of four ellipses. Againthe tu.o all four ellipses and the PLOTting frequency via variables can be selected by he two INPUT commands. Figure 9.8 shows two example COPYs from the screen.
Figure 9.8
Samples of ellipses PLOTted in different directions and long (major) axes.
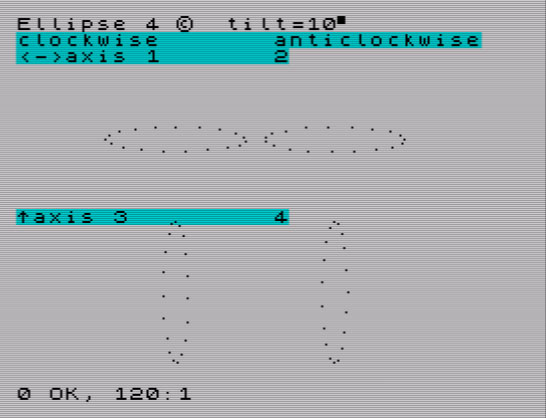
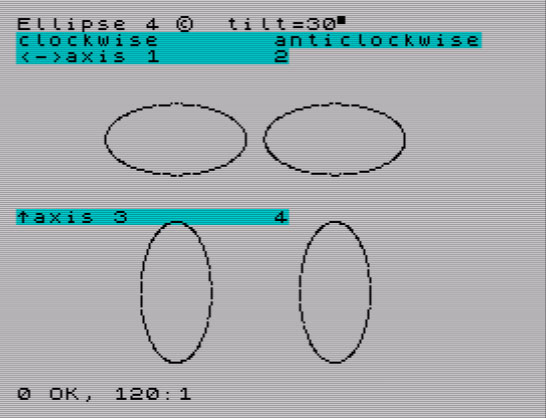
The ellipses are made to PLOT in a clockwise or anticlockwise direction by the exchange of the SIN and COS expressions in each half of the PLOT routine. If the routine commences with the SIN function, PLOTting starts at the 12 o’clock position: if it commences with COS, PLOTting starts at the 3 o’clock position. If the variable angle is in the first half of the PLOT routine, ellipse major axis is vertical and, if it is in the second half, the major axis is horizontal.
Line 100 contains the FOR/NEXT f loop used for PLOTting the ellipse in the form:
FOR f = 0 TO PI*2 STEP l/s*3
where 0 to PI*2 produces a full ellipse. If the expression were to read:
FOR f = PI TO PI*3 STEP…
then a full ellipse would still be PLOTted, but commencing at 180°, or, on the opposite side, at the 6 o’clock or 9 o’clock locations respectively.
Try changing the values in the FOR/NEXT f loop to test this.
10 PRINT “Ellipse 4 @ tilt=”;
30 LET x=132: LET y=76
31 LET x1=x*.6: LET y1=y*1.5
32 LET x2=x*1.2: LET y2=y*1.5
33 LET x3=x*.6: LET y3=y*.5
34 LET x4=x*1.2: LET y4=y*.5
40 LET r=35
50 INPUT “0CHR$130 to 90CHR$130 “,tilt
60 PRINT tilt;”CHR$130 “: PAPER 5
70 PRINT “clockwise”,”anticlockwise”
75 PRINT “axis 1″,”2″
77 PRINT AT 12,0;”^axis 3″,”4”
79 PAPER 7
80 LET angle=1/SIN ((.1+tilt)/180*PI)
90 INPUT “step (1 to 10)”,s
100 FOR f=0 TO PI*2 STEP 1/s/3
111 PLOT x1+SIN f*r,y1+COS f*r/angle
112 PLOT x2+COS f*r,y2+SIN f*r/angle
113 PLOT x3+SIN f*r/angle,y3+COS f*r
114 PLOT x4+COS f*r/angle,y4+SIN f*r
120 NEXT f
Solid Ellipse
This routine uses the DRAW command to produce solid (filled in) ellipses. It actually executes the results about four times quicker than the previous ellipse routines, where the STEP intervals are sufficiently frequent to produce a continuous unbroken outline. This is because it is only necessary to compute one quadrant of an ellipse and to mirror the results in the remaining three quadrants sequentially. Different variable names have been assigned to this routine but the principles are precisely as before. You will notice that, as it is only necessary to compute one quadrant, the FOR/NEXT loop reads:
FOR f = 0 TO PI/2 STEP .012
only one quarter the length of… 0 TO PI*2 … used previously. The STEP interval is fixed at 0.012 as this was found, with this routine, to give the solid form required. If the ellipse is not to fill the Spectrum screen then a larger value can be tested.
The variables a and b are the x and y coordinate positions for the ellipse, where variable e provides the necessary compression to the vertical or minor axis. Line 130 PLOTs the left hand upper outline of the ellipse and Line 140 does the same for the right hand side. The DRAW routines that follow the PLOT commands in the form:
DRAW 0, – b*2
DRAW a vertical line equal to twice the value of b in a downwards direction, so completing the lower portion of the ellipse. Line 200 completes the routine by marking the major (horizontal) and minor (vertical) axes of the ellipse using the OVER command.
The ellipses are made to PLOT in a clockwise or anticlockwise direction by the exchange of the SIN and COS expressions in each half of the PLOT routine. If the routine commences with the SIN function, PLOTting starts at the 12 o’clock position: if it commences with COS, PLOTting starts at the 3 o’clock position. If the variable angle is in the first half of the PLOT routine, ellipse major axis is vertical and, if it is in the second half, the major axis is horizontal.
Line 100 contains the FOR/NEXT f loop used for PLOTting the ellipse in the form:
FOR f = 0 TO PI*2 STEP l/s*3
where 0 to PI*2 produces a full ellipse. If the expression were to read:
FOR f = PI TO PI*3 STEP…
then a full ellipse would still be PLOTted, but commencing at 180°, or, on the opposite side, at the 6 o’clock or 9 o’clock locations respectively. Try changing the values in the FOR/NEXT f loop to test this.
10 PRINT “Solid Ellipse”
20 INPUT “tilt “;z: PRINT “tilt=”;z;”CHR$130 ”
30 LET e=SIN ((.1+z)/180*PI)
40 LET x=255/2: LET y=175/2
100 FOR f=0 TO PI/2 STEP .012
110 LET a=INT (SIN f*y)
120 LET b=INT (COS f*y*e)
130 PLOT x-a,y+b: DRAW 0,-b*2
140 PLOT x+a,y+b: DRAW 0,-b*2
150 NEXT f
200 OVER 1: PLOT 0,y: DRAW 255,0: PLOT x,0: DRAW 0,175: OVER 0
Inclined Ellipse
There are times when an ellipse is required with the major axis, neither vertical nor horizontal but in an intermediate position. This final routine ‘indicates a method of achieving this aim to a modest extent.
Figure 9.9 shows a screen COPY from the program and typical INPUTs and ellipses as PLOTted. The INPUT values for tilt and inclination (rotation of the image) may be from -90° to 90° in each case. Line 90 does the actual work of computing both these factors in the final part of the expression:
…/t + a/z
where variables t (for tilt) and z (for rotation) are the reciprocal SIN values as INPUT. The PLOTting interval (STEP 0.05) and maximum horizontal displacement (value 60 in Lines 80 and 90) are fixed but can be amended to suit the requirements.
The Ellipse routine is used frequently, sometimes in a modified form, for various programs in this book, including Saturn’s Rings, Galaxy, Binary-star Orbits. The expression ‘ellipse’ is in common use to describe the shape of planetary and particular cometary orbits and the shape of optical (lens and mirror) surfaces. Ellipse is one of a family of forms in the conic section which includes the circle, parabola and hyperbola.
Figure 9.9
Typical effects of inclination (rotation of major axis) of an ellipse via this routine.

10 PRINT “Inclined ellipse”
20 INPUT “tilt “;t,”incline “;z
30 PRINT “tilt “;t;”CHR$130 ”
40 PRINT “incl “;z;”CHR$130 “”
50 LET z=1/SIN ((.1+z)/180*PI)
60 LET t=1/SIN ((.1+t)/180*PI)
70 FOR n=0 TO PI*2 STEP .05
75 PLOT OVER 1;140,80
80 LET a=SIN n*60
90 LET b=COS n*60/t+a/z
100 PLOT INT (140+a),INT (80+b)
110 NEXT n: GO TO 20
Ellipses and Kepler’s Orbits
One cautionary note should be observed in using the Ellipse routines to simulate a planet in true elliptical orbit about the Sun, perhaps — where the Sun cannot be in the centre of the ellipse but at one of the foci. Here Kepler’s 2nd Law of Planetary Motion applies and the planet will ‘speed-up’ as it approaches the Sun and ‘slow-down’ as it recedes. The Ellipse program will not in this case give a perfect account of itself but on many occasions the effect can be reasonably convincing. For a correct simulation of Kepler’s 2nd Law, see the Kepler’s Orbits program in Chapter 5, and the sample screen COPYs.
Chapter 9 – Further Programs (Star Tester)
Posted: April 20, 2013 Filed under: Further Programs, ZX Spectrum Astronomy | Tags: Astronomy, Maurice Gavin, Programming, Quiz, Sinclair Basic, Star Tester, Stars, ZX Spectrum Astronomy Leave a commentThe Messier List, check out the fake comets
Telescope, the facts about telescopes, binoculars, cameras and astronomy
Star Tester, a quiz
Ellipses, various ellipses
Spectrum World Map, a map of the world in CHR$ CODE.
Star Tester
This is a short demonstration program to show how a simple quiz, using questions and answers, can be set up. Obviously, the quiz does not have to relate to astronomy, but it does for the purposes of this book. The program as it stands contains only ten star names, grouped in pairs in a$ and this is far too few to be really effective. In the example, ‘Antares’ = ‘Alpha Scorpii’, ‘Regulus’ = ‘Alpha Leonis’ — these are the alternative names for each star.’ Thus the program is ripe for expansion by the user perhaps with entirely different paired names.
The program
The program works in the following way. A DIMensional array is set up in line 30 to accept (in this case) 10 names with a maximum length of 13 characters to cope with the longest a$ – a$(2), a$(6) and a$(10) all have a total of 13 letters and spaces. A DIM b$(13), a single DIMensioned array, is also set up to receive the answers to be INPUT in Line 230.
The computer asks the user up to ten questions via the FOR/NEXT f loop in Line 160. The variable z in Line 170 selects a RANDOM number between 1 and 10 and PRINTs to the screen the a$ with this number. The computer also decides that the answer will be:
a$(z + t)
where variable t acts as a switch eg
if z = 1 then t = 1 if z = 2 then t = – 1
and so on for each odd or even number that is thrown up for z so that t has a value of 1 or – 1 as the case may be. If a$(l) to a$(10) in Lines 40 to 130 inclusive are checked, then it can be seen that the computer has identified each answer correctly by grouping the a$ in pairs.
Line 230 INPUTs and PRINTs the answer, and the ‘?’ is overprinted by using the expression PRINT CHR$ 8; b$. Lines 310 and 320 mark the answers and tot up the correct results with the variables score which is PRINTed at the end of the f loop.
The program uses the automatic scroll conditions by POKEing (POKE 23692, 255) and PRINTing below screen line number 21, so that the questions and answers flow up from the bottom of the screen next to the INPUT line 22. This is effected by program Line 350. Figure 9.5 is a typical COPY of the screen display.
Figure 9.5

Although the computer is looking for an answer which is precisely correct in upper and lower case lettering, there are insufficient permutations in a range of numbers from 1 to 10 without frequent repetition. Ideally the minimum should be about 30 questions, ie 15 paired questions/answers — preferably more to avoid repetition. Amending the program to receive extra questions involves minimal changes and can be done in two ways.
1) Additional listing in the a$
This is fairly straightforward and simply means squeezing more a$s into the listing, starting at a$(ll) — assuming the first 10 questions/answers in the listing are to be retained. For neatness, Lines 40 to 130 should be renumbered (perhaps as Lines 40 to 50 inclusive) and the extra new items for the a$ started from Line 51:
51 LETa$(11) = “…star name 6a…”
52 LETa$(12) = “…star name 6b…”
53 LETa$(13) = “…star name 7a…”
54 LETa$(14) = “…star name 7b…”
55 LETa$(15) = “…
and so on with all the extra data. Finally, amend the DIMensional array in Line 30 to account for the extra questions included:
30 DIM a$ (total number in a$, 13): DIM b$(13)
and amend the last value in the Line 170:
170 LET z = 1 + INT (RND*total number of questions in a$)
The program can now be RUN (RUN because all the program is contained in the LISTing).
2) INPUT subroutine
There is no particular need for the questions and answers to appear in the program and they can be INPUT via a subroutine. The procedure is as follows:
Delete Lines 20 to 130 inclusive
Amend Line 280 (final command) to GOTO 1 (in lieu of RUN)
Add the subroutine 400 DIM a$(50,13): DIM b$(13)
This allows for 50 questions/answers — 25 pairs — a maximum of 13 characters long, including spaces.)
410 FOR n = 1 TO 50
420 PRINT n; ” “; LET c$ = “”
430 INPUT c$ : PRINT c$
440 IFc$ = “stop” THEN STOP
450 LET a$(n) = c$
460 NEXT n: STOP
The subroutine is started with GOTO 400 and the paired questions/answers are INPUT sequentially. It is not necessary to use up all the DIMension a$ array if you run out of questions as long as the last INPUT was an even numbered item. Simply INPUT “stop” and Line 440 will STOP the program. The program should now be SAVEd with GOTO 9990 as a precaution and VERIFYed. Now amend Line 170 to read:
170 LET z = 1 +INT(RND*(n-l))
The variable n is the last value + 1 used in the INPUT loop in Line 440. The program should be SAVEd and VERIFYed as version no 3 by amending Line 9990 to read:
9990 SAVE “startest3” LINE 1
and then, as a direct command, GOTO 9990. The amendment will ensure that the program starts automatically when LOADed with LOAD “”or LOAD “startest3” (which is preferred) and so avoid the pressing of the RUN key which will erase all the DATA from the computer. All would not be lost of course — simple reLOAD but this time enter GOTO 1.
Now that the program is safely on tape, it is time to test the program started with GOTO 1.
Adding more questions
If less than the full quota of 50 questions/answers was initially INPUT, then more can be added by BREAKing the program and entering as a direct command:
CLS: GOTO 420
which will pick up the INPUT routine where it left off and start the n loop again. Again the INPUT can be terminated before all 50 items have been entered with:
INPUT “stop”
and as a direct command to restart the quiz with GOTO 1. The current value of n will again update the maximum RANDOM number for the variable z. It is a wise precaution to SAVE each version where more DATA is INPUT before the quiz is tested. Better safe than sorry.
10 REM Star Tester
30 DIM a$(10,13): DIM b$(13)
40 LET a$(1)=”Antares”
50 LET a$(2)=”Alpha Scorpii”
60 LET a$(3)=”Regulus”
70 LET a$(4)=”Alpha Leonis”
80 LET a$(5)=”Betelgeuse”
90 LET a$(6)=”Alpha Orionis”
100 LET a$(7)=”Vega”
110 LET a$(8)=”Alpha Lyrae”
120 LET a$(9)=”Rigel”
130 LET a$(10)=”Beta Orionis”
140 LET score=0
160 FOR f=1 TO 10: LET t=1
170 LET z=1+INT (RND*10)
180 LET q=z/2
190 IF INT q=q THEN LET t=-1
200 GO SUB 340
210 PRINT f;”)”;a$(z);” is? “;
220 LET x$=a$(z+t)
230 INPUT b$: PRINT CHR$ 8;CHR$ 8;” “;b$
240 GO SUB 300: LET x=z
250 GO SUB 340: PRINT : NEXT f
270 GO SUB 340: PRINT “Your score: “;score;” correct answers”
280 PRINT FLASH 1;” Try again? – press any key “: PAUSE 0: RUN
300 GO SUB 340
310 PRINT PAPER 5; FLASH 1 AND b$x$;x$;
320 IF b$=x$ THEN LET score=score+1: PRINT PAPER 6; FLASH 1;” is correct”: GO TO 340
330 PRINT PAPER 5;” is the answer!”
350 POKE 23692,255: PRINT AT 20,0: PRINT : RETURN
Chapter 9 – Further Programs (Telescope)
Posted: April 20, 2013 Filed under: Further Programs, ZX Spectrum Astronomy | Tags: Astronomy, Further Programs, Maurice Gavin, Programming, Sinclair Basic, Telescope, ZX Spectrum Astronomy Leave a commentThe Messier List, check out the fake comets
Telescope, the facts about telescopes, binoculars, cameras and astronomy
Star Tester, a quiz
Ellipses, various ellipses
Spectrum World Map, a map of the world in CHR$ CODE.
Telescope
This program sets out to answer the following questions:
- What is the faintest star visible in a 6 cm or a 6 m telescope?
- What is the maximum and minimum useful power eyepiece to use?
- Why is the Hale 5 m telescope not suitable visually?
- What sort of area in degrees will a 35 mm camera lens cover?
- What is the photographic and visual resolution of a 15 cm telescope?
- What astronomical performance can I expect from my telescope/camera?
The last question summarizes most of the previous questions.
The answers
There is nothing particularly special about this program other than the fact that it brings together all the facts and figures pertinent to telescopes, binoculars and cameras, when used for astronomy. Only two items have to be INPUT — the aperture of the instrument in millimetres and the f/ratio as it is called. The latter is the ratio of the diameter of the lens (of the camera, for example) against the focal length and this in turn is the distance from the lens to the image the lens forms. From these two INPUTs a lot of data can be computed in just one second that would need a library of books to reference. Just key in the program and RUN it.
The program
The program is based on my own many years of practical experience at the telescope. Only one item — the visual or Dawes resolving power of a telescope — assumes a perfect instrument, perfectly aligned on a perfect night free from atmospheric turbulence (twinkling stars) and an experienced eye. The balance of the items is either reasonably indisputable (like the power of a given eyepiece) or not too contentious (like the limiting visual magnitude attainable on a clear night away from town lights).
Figure 9.3 shows a screen COPY for an f/4 120 mm focal length camera lens and Figure 9.4 a screen COPY for my own telescope. It may be useful to go through each sample and the relevant program lines to explain the significance of the data.
Figure 9.3
Astro performance of f/4: 120 mm fl lens.
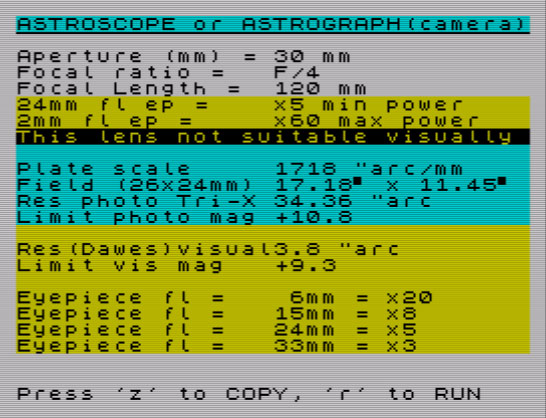
Figure 9.4
Astro performance of a 44.4 cm (17.5 inch) aperture telescope.

The first two lines of the printout are the INPUT of aperture and f/ratio and these, multiplied together, produce the third line — focal length. The next two lines are the maximum and minimum power eyepieces for the system and their respective focal lengths. It will be noted that the next line in Figure 9.3 for the camera lens comments: “This lens not suitable visually”
This is worked out by slicing the A$ and T$ in Line 20 according to the conditional Lines 170 and 180. In this case the focal length is less than 300 mm and therefore not identified as a telescope.
The next group of four items specifically refers to the photographic performance of the instrument. The items are, in order, the ‘plate scale’ or number of seconds of arc per mm of film, the area in degrees for a 35 mm format camera, the resolving power of TRI-X film in seconds of arc and, finally, the faintest star normally recorded in a guided exposure before skyfogging (stray light) sets in. The next group of two items refers to the visual resolving power (to Dawes formula) in seconds of arc and the limiting visual magnitude the instrument will show. Notice how a given lens or telescope will record stars on film to 1.5 magnitude less than the eye will record at the same instrument. This is because the eye (when fully adapted to dark conditions) sees no more after about quarter of a second, however much you peer through the eyepiece, whereas the photographic film slowly builds up an image over seconds, minutes and even hours in perfect conditions. The human eye’s sensitivity is much superior to the fastest 1000 ASA film but tires easily. Also the eye’s resolving power — pixel for pixel — is again superior to all but the slowest film, say 20 ASA.
The final section of the printout gives some typical focal length eyepieces and notes the effective powers with the lens concerned. This is done by the FOR/NEXT loop in Lines 250 to 270. An option to COPY the screen is included on Line 290.
Interpreting results
Practical experience would indicate that any telescope magnifying more than x 500 is pointless. The Earth’s atmosphere is never steady enough to support such a magnification and remain sharp and clear. Line 100 sets this upper limit: otherwise Line 90 assumes that the aperture (in mm) x 2 is the upper limit. The lowest useful power eyepiece is set by the maximum diameter of the human pupil, 7 mm when adapted to dark. I have adopted a diameter of 6 mm from practical experience of numerous tests. Effectively, if the eyepiece power is too low, not all the light entering the telescope reaches the retina because of the physical limit to the diameter of the eye’s iris.
In the case of the Hale 200-inch telescope at Mt Palomar with a clear aperture exceeding 5000 mm, a minimum power eyepiece exceeding x 750 would be necessary for all the light to enter the eye for the reason mentioned above. This giant telescope is not for looking through but is a huge camera for peering into the most remote regions of the cosmos.
The following variables carry the various formulae used in the program:
A = the clear aperture in mm
F = the focal ratio of system
FL = the focal length of system in mm
L = lowest useful power eyepiece
H = highest useful power eyepiece
V = limiting visual stellar magnitude P = plate scale in ” arc/mm
The two last variables are also used for the following:
P/100 = field width in degrees
P/50 = TRI-X film resolving power in ” arc/mm
V + 1.5 = limiting photo magnitude 114/A = Dawes visual resolution
5 REM Telescope Performance
10 CLS : PRINT PAPER 5;”ASTROSCOPE or ASTROGRAPH(camera)””
15 PLOT 0,167: DRAW 255,0
20 LET a$=”not suitable visually”: LET t$=”Telescope This lens ”
30 PRINT “Aperture (mm) =”,
40 INPUT a: IF a500 THEN LET h=500
110 LET v=1.9+INT (LN (a*a)*11)/10
120 LET p=INT (206264/fl)
130 PRINT “Focal Length =”,fl;” mm”
139 PAPER 6
140 PRINT INT (fl/l+.5);”mm fl ep =”,”x”;l;” min power”,
150 PRINT INT (fl/h*10)/10;”mm fl ep =”,”x”;h;” max power”,
160 IF l>=h THEN PRINT FLASH 1;t$( TO 10);a$,
170 IF l=25 AND fl>=300 THEN PRINT FLASH 1;t$( TO 10);a$(5 TO ),
180 IF l<h AND (a<25 OR fl<300) THEN PRINT FLASH 1;t$(11 TO );a$,
190 PAPER 5: PRINT ,,”Plate scale”,p;” “”arc/mm”,
200 PRINT “Field (26x24mm)”,INT p/100;”[G]2 x “;INT (p*2/3)/100;”[G]2 “,
210 PRINT “Res photo Tri-X”,INT (p*2)/100;” “”arc”,
220 PRINT “Limit photo mag”,”+”;v+1.5,
229 PAPER 6
230 PRINT ,,”Res(Dawes)visual”;INT (11400/a)/100;” “”arc”,
240 PRINT “Limit vis mag”,”+”;v,,,
250 FOR n=1 TO 6 STEP 1.5
260 PRINT PAPER 6;”Eyepiece fl = “,(” ” AND n=1);6*n;”mm = x”;INT (fl/6/n),
270 NEXT n: PAPER 7
280 PRINT #0;”Press ‘z’ to COPY, ‘r’ to RUN”: PAUSE 0
290 IF INKEY$=”z” THEN COPY
300 RUN
Chapter 9 – Further Programs (The Messier List)
Posted: April 20, 2013 Filed under: Further Programs, ZX Spectrum Astronomy | Tags: Astronomy, Charles Messier, Further Programs, Maurice Gavin, Messier List, Programming, Sinclair Basic, ZX Spectrum Astronomy Leave a commentThe Messier List, check out the fake comets
Telescope, the facts about telescopes, binoculars, cameras and astronomy
Star Tester, a quiz
Ellipses, various ellipses
Spectrum World Map, a map of the world in CHR$ CODE.
The following programs do not fit conveniently into previous chapters and have been gathered here. Although they are all diverse, I hope that you will find them interesting.
The Messier List
There is great kudos in having one’s name permanently applied to a heavenly body, but chance discoveries are exceptionally rare and an intimate knowledge of the night sky is really required if you are to have any hope of success.
Curiously, the French astronomer Charles Messier is renowned no longer for the many comets he discovered, but for his ‘Catalogue of 104 Non-stellar Objects’ (published in 1784) which forewarned the unwary against false claims: each object on the ‘Messier List’ is a remote deep-sky nebula or galaxy which appears comet-like in a small telescope or binoculars.
The program
The following program, designed around the ‘Messier List’, indicates how DATA can be stored economically in CODE form in string arrays. The program has two options:
- To list all 104 obj ects in numerical sequence with host constellation and type of object.
- To quiz the user as to where a random selection of these objects are to be located.
Good use is made of Spectrum colour to enliven the displays and to mark your score in the quiz mode. In the latter your initial title of ‘ASTRONOMER’ is slowly cut down in size for each incorrect answer!
Data store
The DATA is stored in the following manner:
a$ = 104 characters in the range 0 to 9 & A to Y (total = 35) for the 35 constellations hosting the 104 objects.
c$ = 35 constellation names to correct IAU abbreviations.
k$ = 104 numeric CODEs in the range 0 to 5 (total = 6 CODEs) for the class of object.
Unlike the non-standard ZX-81 CHR$ set (on which this program was originally designed), CHR$ 0 to 9 and A to Y are not consecutive in the Spectrum ASCII set (used for this book). Thus the a$ is handled in two ways to extract the DATA used in the variable z as follows:
270 IF CODE a$(n) < 58 THEN LET z = 1 + VAL a$(n): GOTO 290 280 LET z = CODE a$(n) – 54
Lines 410 and 420 work in a similar way. Consult your Spectrum Manual to see the values returned by various CODEs. The k$ is used to return a VALue used in the conditional GOSUB eg:
320 GOSUB 100 + VAL k$(n)* 10 ie GOSUB 100, 110, 120 etc.
and then PRINT the object type (eg ‘an open cluster’) and RETURN. Line 480 works in a similar way.
Figure 9.1
First page of the Messier List.

Figure 9.2
The screen display in quiz mode.
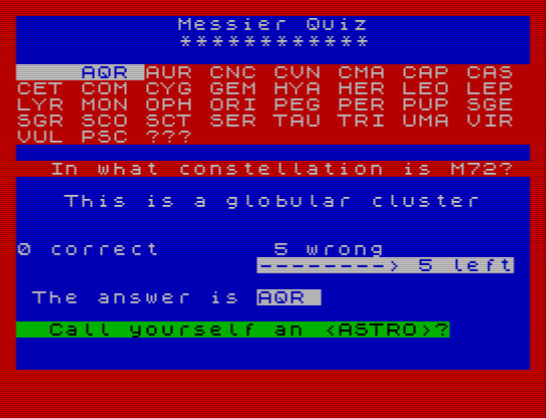
RUNning the program
Once the program has been keyed in and RUNs satisfactorily as checked against the sample screen displays in Figures 9.1 and 9.2, it is worth remembering to set the CAPS LOCK. In the quiz mode lower case answers are unacceptable. If you need a little help and have aZX printer, the ‘Messier List’ can be COPYed a ‘page’ at a time with:
BREAK COPY ENTER
When the COPY is complete, press CONTINUE ENTER for the next page.
10 REM Messier List & Quiz
20 DIM b$(20): INK 9
30 LET y$=”ASTRONOMER”
40 LET a$=”S14PRPPOIIQIDIKROOIOOOOOOQWOA600TL
B222AU5JJ35MMCVH479OOGGVVVVP49EE3COON11XOLBJF
PUUCV9VV9VVYDM4EEU999UY7V”
50 LET c$=”AND AQR AUR CNC CVN CMA CAP CAS CET COM CYG GEM HYA HER LEO LEP LYR MON OPH ORI PEG PER PUP SGE SGR SCO SCT SER TAU TRI UMA VIR VUL PSC ??? ”
60 LET K$=”4222211422122221412412111132125551
111110144111115151222235555255551222221523542
2555555555502155535555015″
70 GO TO 200
100 PRINT “a Messier mistake!”
105 RETURN
110 PRINT “an open cluster ”
115 RETURN
120 PRINT “a globular cluster”
125 RETURN
130 PRINT “a planetary nebula”
135 RETURN
140 PRINT “a diffuse nebula ”
145 RETURN
150 PRINT “an external galaxy”
155 RETURN
200 INPUT “Messier List or Quiz (l or q)?”, LINE l$: CLS : PAUSE 1
210 IF l$”l” AND l$”L” THEN GO TO 360
230 PRINT TAB 10;”Messier List”
240 PRINT TAB 10;”************”: GO SUB 600
250 PRINT “No Con Code Type”
260 PRINT : FOR n=1 TO 104
270 IF CODE a$(n)<58 THEN LET z=1+VAL a$(n): GO TO 290
280 LET z=CODE a$(n)-54
290 LET j=VAL k$(n)
300 BEEP .01,j*10: PAPER j
310 LET x$=c$(z*4-3 TO z*4)
320 PRINT “M”;n;TAB 5;x$+a$(n)+””+k$(n);” “;
330 GO SUB 100+VAL k$(n)*10
340 IF n/5=INT (n/5) THEN PRINT
350 NEXT n: PAPER 7: GO TO 590
365 POKE 23658,8
370 LET c=0: LET w=0
380 FOR n=1 TO 10: CLS
390 LET r=1+INT (RND*103)
400 IF r=40 OR r=91 OR r=102 THEN GO TO 390
410 LET k=VAL k$(r): BORDER k: LET d=w
420 IF CODE a$(r)<58 THEN LET z=1+VAL a$(r): GO TO 440
430 LET z=CODE a$(r)-54
440 LET x$=c$(z*4-3 TO z*4)
450 PRINT TAB 10;”Messier Quiz”
460 PRINT TAB 10;”************”
470 PRINT PAPER k’c$+b$”” In what constellation is M”;r;”?”+(” ” AND r<100)+(” ” AND r<10)
480 PRINT ‘” This is “;
490 GO SUB 100+VAL k$(r)*10
500 INPUT t$: LET t$=t$+” ”
510 IF t$=x$ THEN LET c=c+1: GO SUB 600
520 IF t$x$ THEN LET w=w+1
530 PRINT ”c;” correct”,w;” wrong”
540 PRINT FLASH 1;AT 15,(d-w)*15;”——–> “;10-n;” left”
550 IF t$x$ THEN BEEP .2,-16: BEEP .5,-30: PRINT ‘” The answer is “; FLASH 1;x$;AT 3+INT (z/9),0;TAB (z-1)*4;x$
560 PRINT PAPER n-1;AT 19,0;” Call yourself an ?”
570 PAUSE 300: NEXT n
580 PRINT PAPER 1; PAPER 4′” Time is up “+y$+b$( TO 8)
585 POKE 23658,0
590 GO SUB 600: PRINT #0;” Press any key to continue.”: PAUSE 0: GO TO 200
600 FOR a=-30 TO 30 STEP 5: BEEP .1,a: NEXT a: RETURN
Chapter 8 – Starcharts (Stellar Magnitude)
Posted: April 13, 2013 Filed under: Starcharts, ZX Spectrum Astronomy | Tags: Astronomy, Hipparchus, Maurice Gavin, Pogson, Programming, Sinclair Basic, Starcharts, Stars, Stellar Magnitudes, ZX Spectrum Astronomy Leave a commentStarmaps, display a simple starmap
Constellation Plot, entering star patterns with CHR$ CODEs
Stellar Magnitudes, plotting differing star brightnesses
Star Graphics, constructing complex shapes
Flashing Stars, two ways to make stars flash
Startrax, watch the changing shapes of the constellations over hundreds of thousands of years
Stellar Magnitude, magnitude ranges of stars.
Stellar Magnitude
Astronomers have a scale to measure the apparent brightness of the stars called magnitude. This was first classified by Hipparchus in 127 bc: he described ‘the brightest stars as magnitude 1’ and ‘the faintest stars as magnitude 6’ with four steps in between. This basic system has been retained ever since, but of course refined and explained mathematically, principally by Pogson in the last century. Pogson ascribed a value of 2.512 to 1 as a ratio between one whole magnitude and the next. This equates to a ratio of 100:1 for a star of first magnitude against a star of sixth magnitude just visible to the naked eye. Pogson also noted that the common logarithm of 2.512 is precisely 0.4, much simplifying computation.
This short program uses a simple FOR/NEXT loop to PRINT to the screen a magnitude range from -26 (the Sun) to +24 (faintest star detected with the 200-inch Hale telescope at Mt Palomar, California). The ratio to the standard star Vega at magnitude 0.0 is also displayed for each whole magnitude step. Our Sun proves to be 1:2.51E10 (25,000,000,000) times brighter than Vega: a magnitude +24 star proves to be about a similar ratio fainter than Vega.
Using a series of conditional PRINT statements the list is punctuated by some mainly familiar objects that match particular magnitudes. The standard star Vega is made to FLASH to identify itself readily.
The Spectrum does not use common logs but natural logs (LN function) to a base of 2.71828 … so Pogson’s neat common log relationship has to be fudged in this program, via Line 80, to give a ratio of 100:1 over five magnitudes.
10 REM Stellar Magnitude
15 PRINT “Mag Name”,”1:ratio”
20 FOR n=-26 TO 24 STEP 1
30 PRINT PAPER 6;(” ” AND ABS n0);n;” “;
37 PAPER 5
40 PRINT “Sun” AND n=-26;
41 PRINT “Full Moon” AND n=-13;
42 PRINT “Venus” AND n=-4;
43 PRINT “Sirius” AND n=-1;
50 PRINT FLASH 1;”Vega-standard” AND n=0;
51 PRINT “Uranus” AND n=5;
52 PRINT “Neptune” AND n=8;
53 PRINT “Barnard’s Star” AND n=10;
60 PRINT “Pluto” AND n=14;
61 PRINT “200”” eye limit” AND n=19;
62 PRINT “200””photolimit” AND n=24;
70 PAPER 7
80 PRINT TAB 18;EXP (LN 2.51193*-n): NEXT n

